Long Term


Not losing is the first step of winning … I am not a certified market expert … This site is only for tracking my market activities
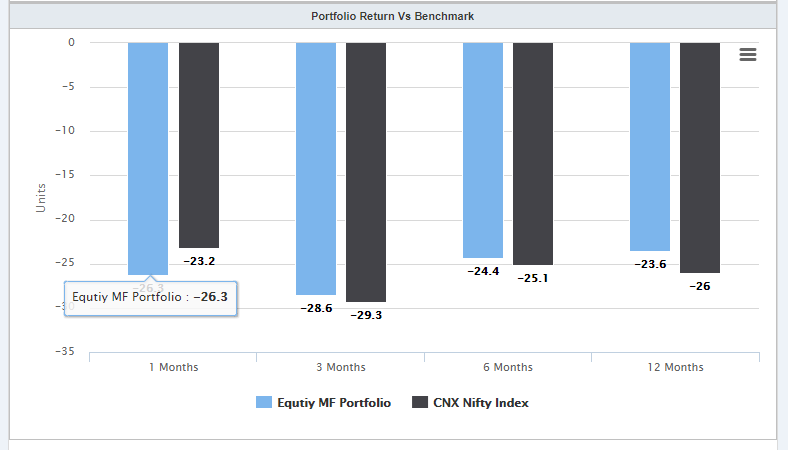
Long Term
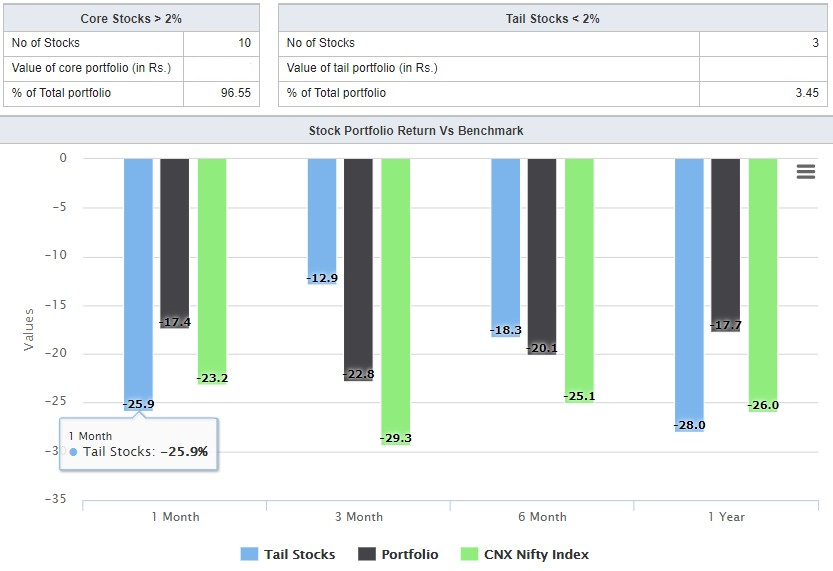
Medium Term
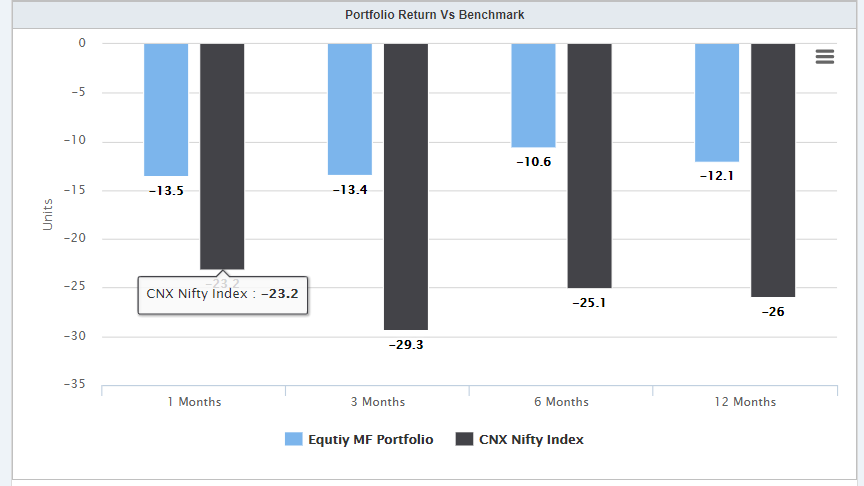
Long Term
What I understood reading books and observing the markets over a decade … is In long term, price follows earnings which is reported Quarterly. So this is what I call the FA signal. For the remaining of 89 days, stock price moves here and there, based on supply and demand without any solid reason behind them. This is the noise. One need to remove these noise from the price movement to get a feel of where the stock is going. TA makes meaning out of this noise and makes profit.
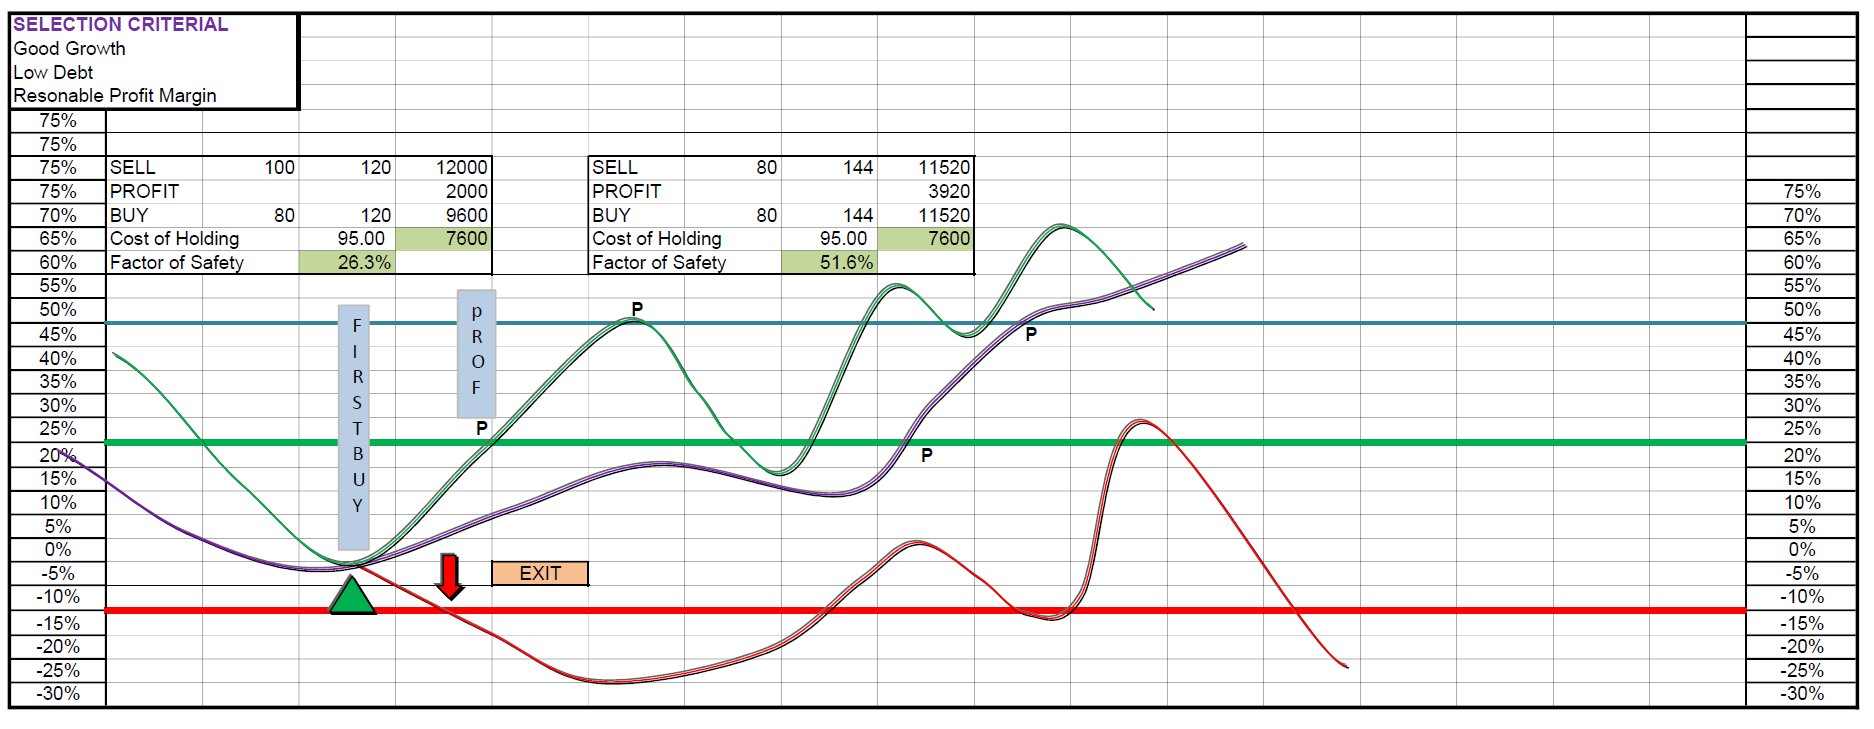
 I collect watchlist of stocks from Result performance, Expert Picks, Recommendations from fund houses etc … and buy the first lot at a technically opportune time
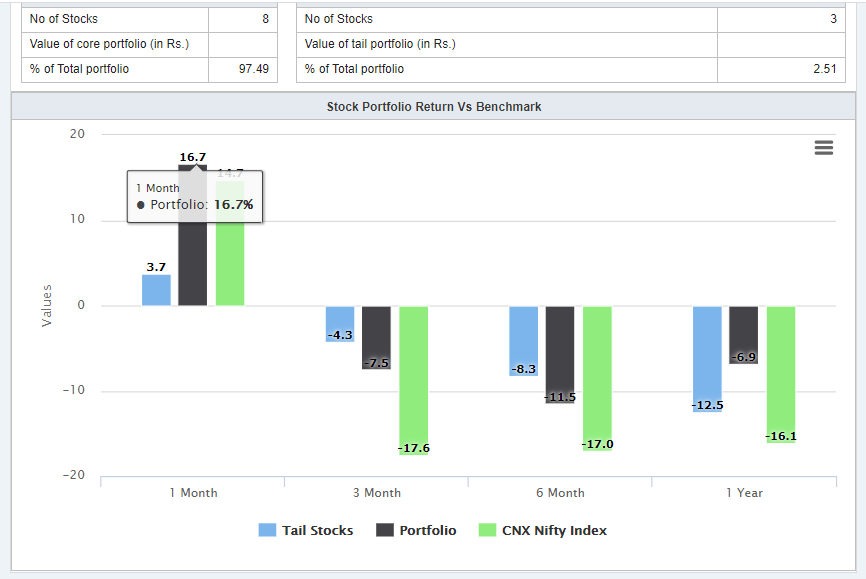
When it reaches at a predetermined Target Price I sell all and buy 75% Quantity Quantity the same day at current market price
Now the safety factor achieved is 29%
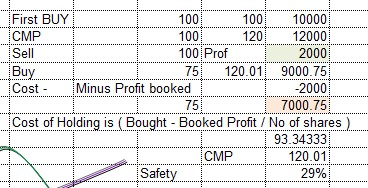
Used to go on doing the same profit booking system till I gain confidence in the stock … if a stock retraces and comes back to the cost of holding price …. I exit without any hesitation.
After two profit bookings … a stock shall normally never make a loss again as the position building is gradual by averaging on the rise …. Unless otherwise there is a very valid reason I do not average on the way down
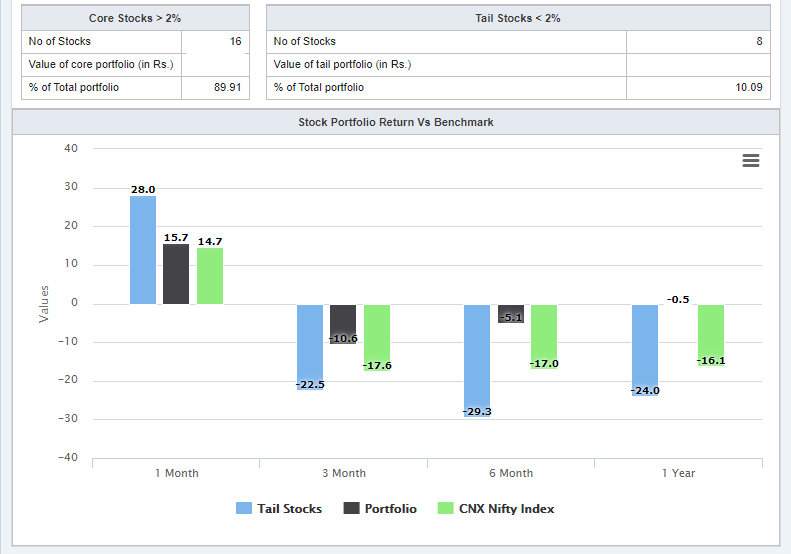
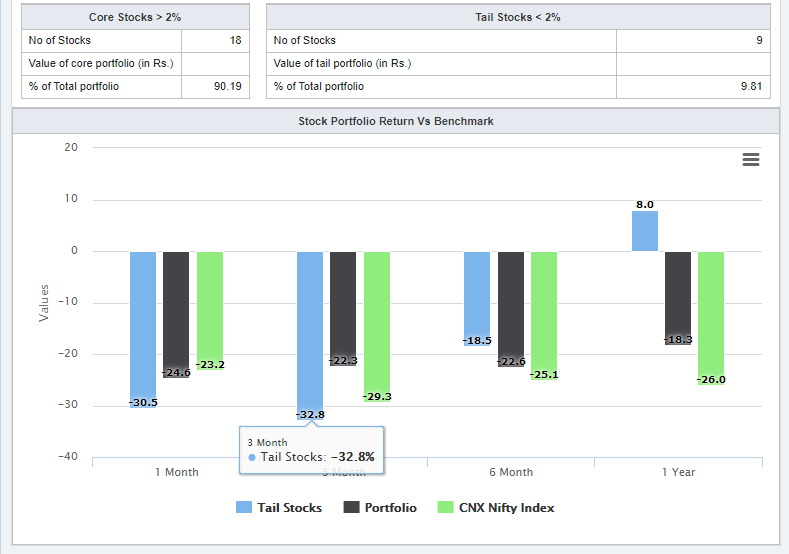
I have tried to explain with three stocks my profit booking analogy,,, hope it is understandable
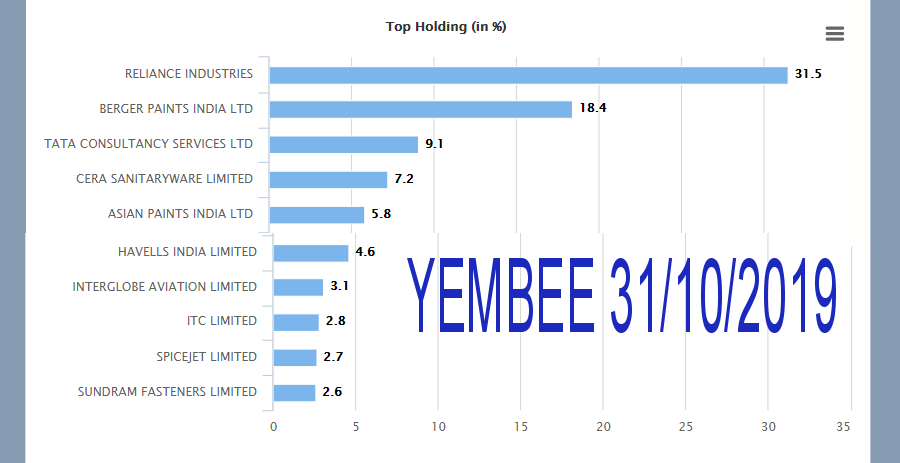
After er a reasonable size is built up in a stock … it becomes part of the long term portfolio. It is a very boring process …Like stamp collection, it is a stock collection process
Once a stock enters into the Long Term Portfolio, I trim/add based on market condition. I book profit when the valuation goes beyond justifiable fundamentals … Like I did in Berger paints and start a SEP for the same amount booked …
I am happy with this process …. any suggestions welcome
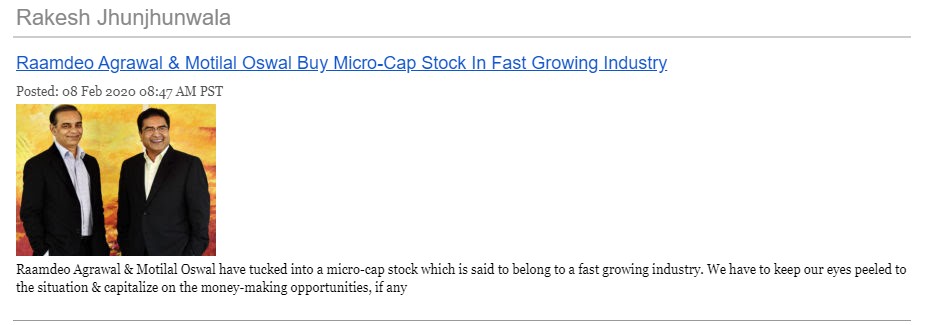
Checked the numbers … yes, Sales growth is there … But all the symptoms of a bad company are also there … Huge debt … 70% Pledge
These Gurus are established stock Pickers … Let me closely watch How things change
Good …. These Guys are having the advantage of close to Management . IPO came for establishing Mega Factory of multifold production …. May be Factory is ready … RA s picks all are catching young the future champions
FA analysis is lagging information that gives a historical perspective and expects the history to extrapolate … It has no vision for the future. Business foresight is anticipating the market share and determining the Enterprise value
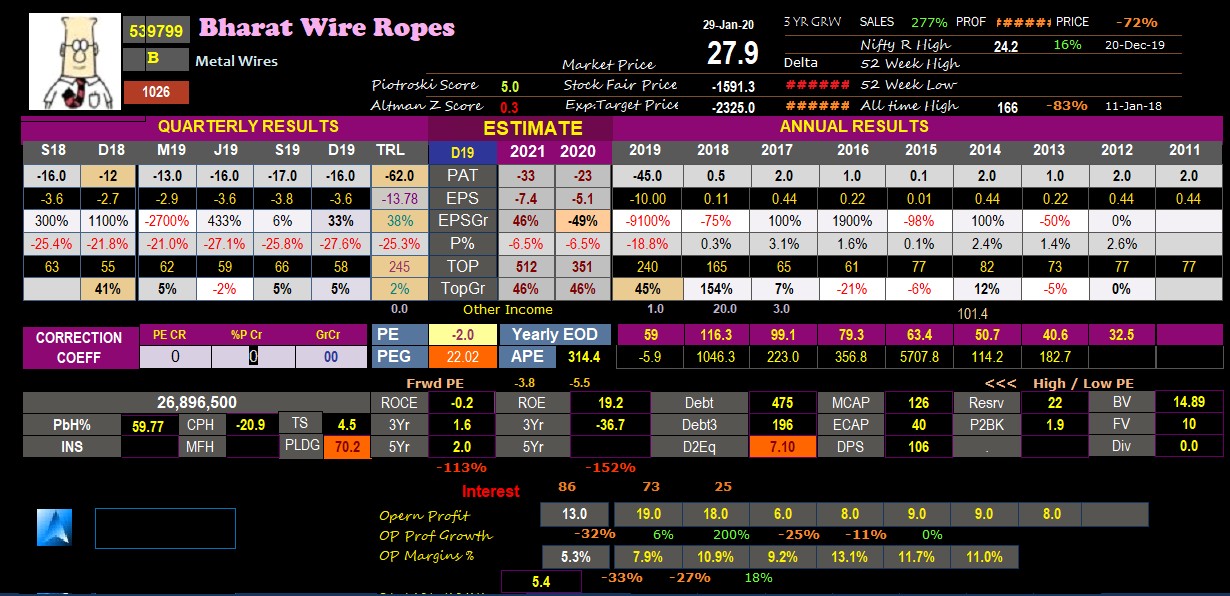
10 YEARS DATA DASHBOARD
During the process of learning, I looked into various websites to analyze the Earning / Fundamental data. I had to click through many pages –
Thought of designing a stencil to have a single page Dashboard which gives an overall view of a company
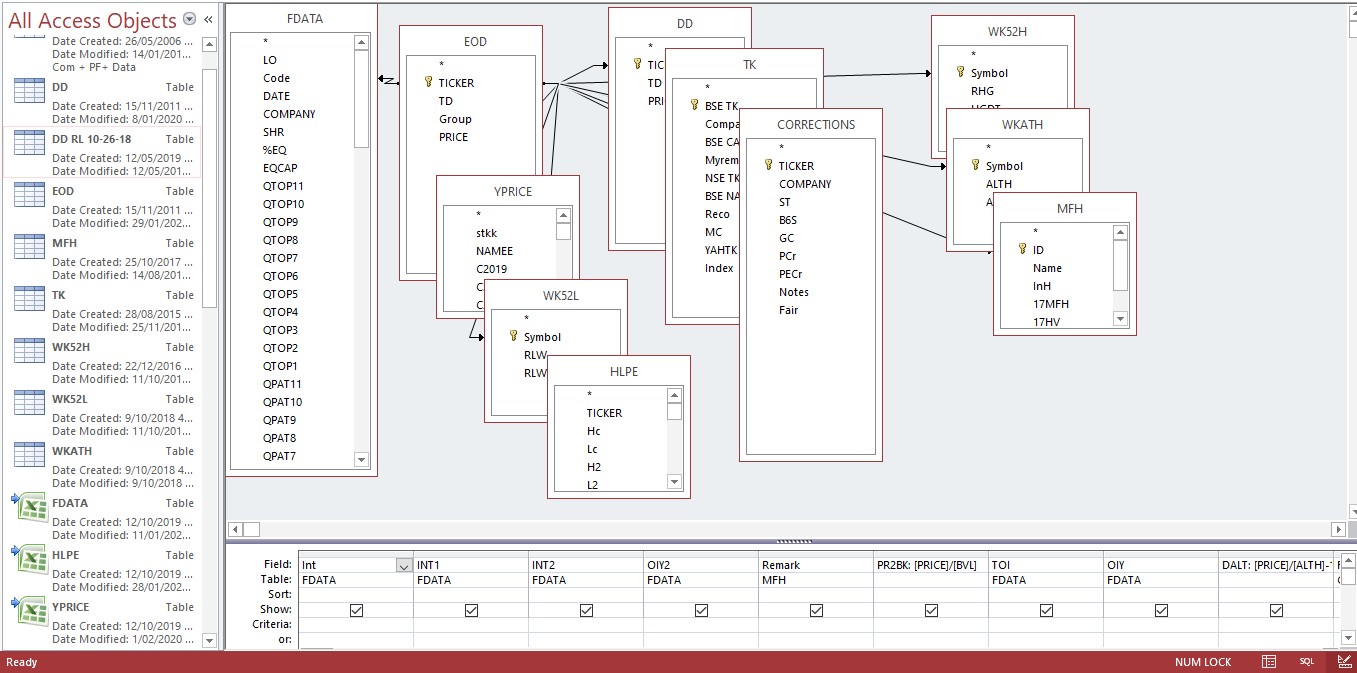
I am not a software guy … I am a bit familiar with Access database and developed this stencil
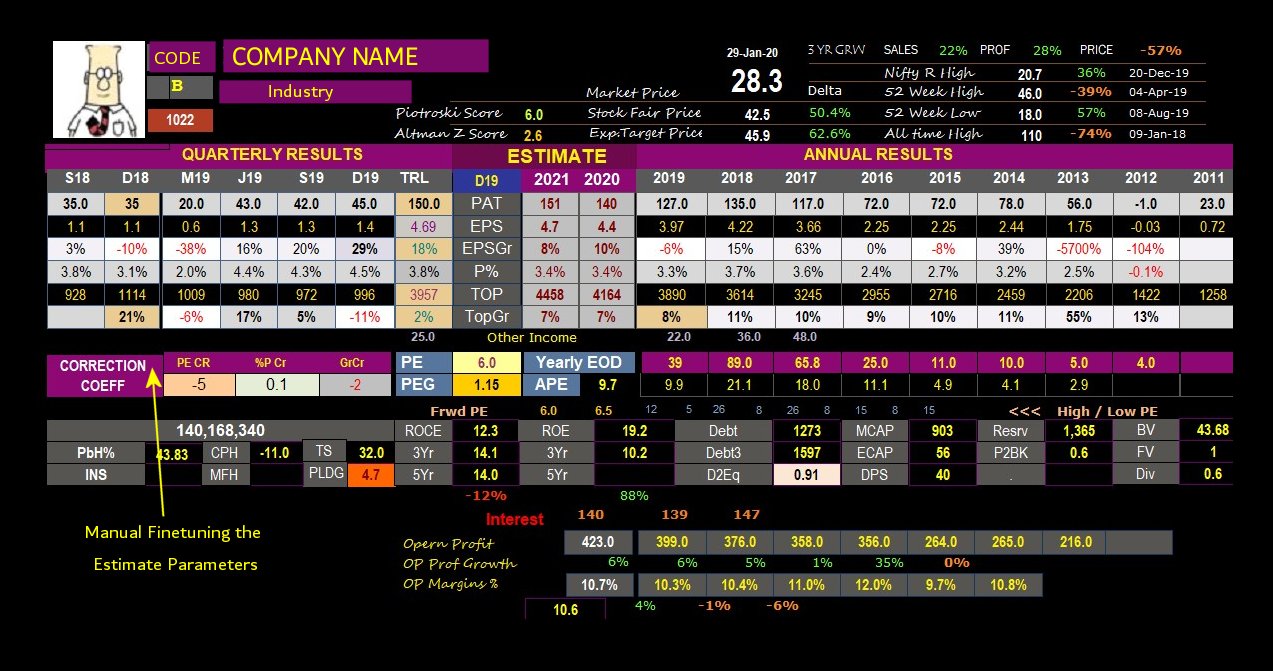
This stencil gives, in a nutshell, the last 10 years’ annual sales and Sales growth, PAT, Profit Margin and Margin Growth . last few Quarters results…
A fair price based on historical valuations and a Target Price based on the hypothesis that Expected Returns are an extrapolation of what had been achieved historically.
Data Inputs
Excel File containing Quarterly / Annual Results ( Sources: Screener.in , Ratestar .in )
EOD files from BSE Site
All are linked via Access Query and the result is expressed in an Access Form
https://drive.google.com/file/d/1vIoUsVRN4RGOtY2cISATGECUeov_p3Ij/view?usp=sharing DOWNLOAD LINK
LT