
10 YEARS DATA DASHBOARD
During the process of learning, I looked into various websites to analyze the Earning / Fundamental data. I had to click through many pages –
Thought of designing a stencil to have a single page Dashboard which gives an overall view of a company
I am not a software guy … I am a bit familiar with Access database and developed this stencil
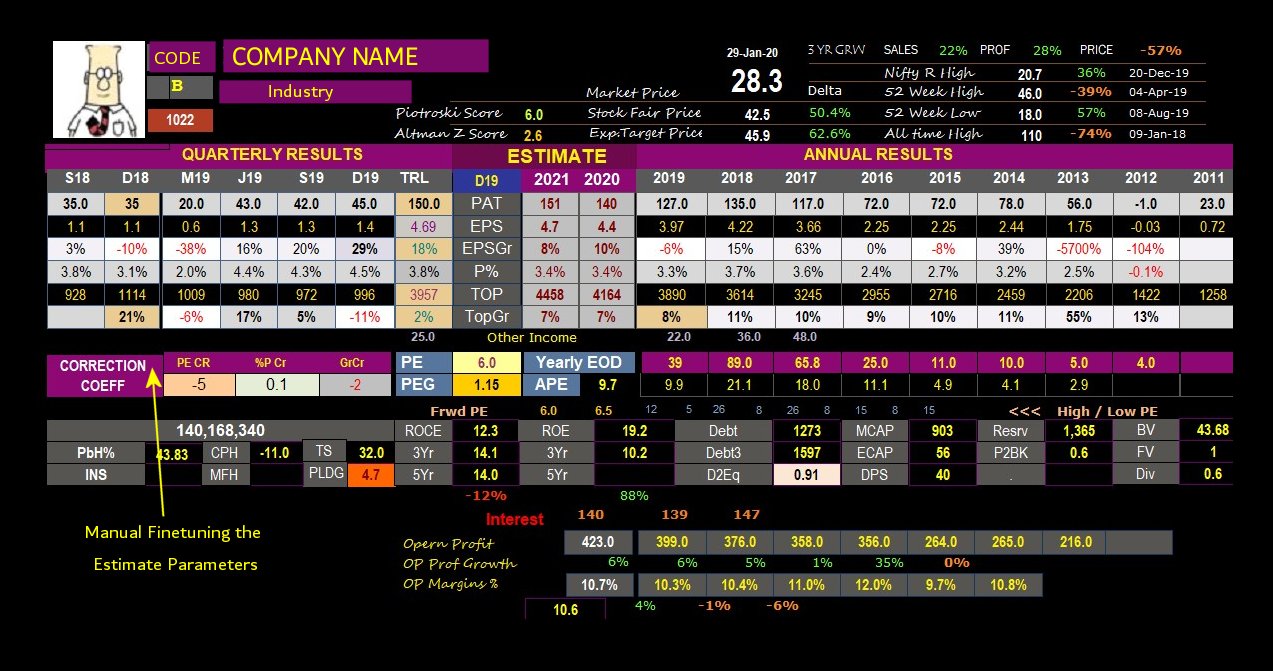
This stencil gives, in a nutshell, the last 10 years’ annual sales and Sales growth, PAT, Profit Margin and Margin Growth . last few Quarters results…
A fair price based on historical valuations and a Target Price based on the hypothesis that Expected Returns are an extrapolation of what had been achieved historically.
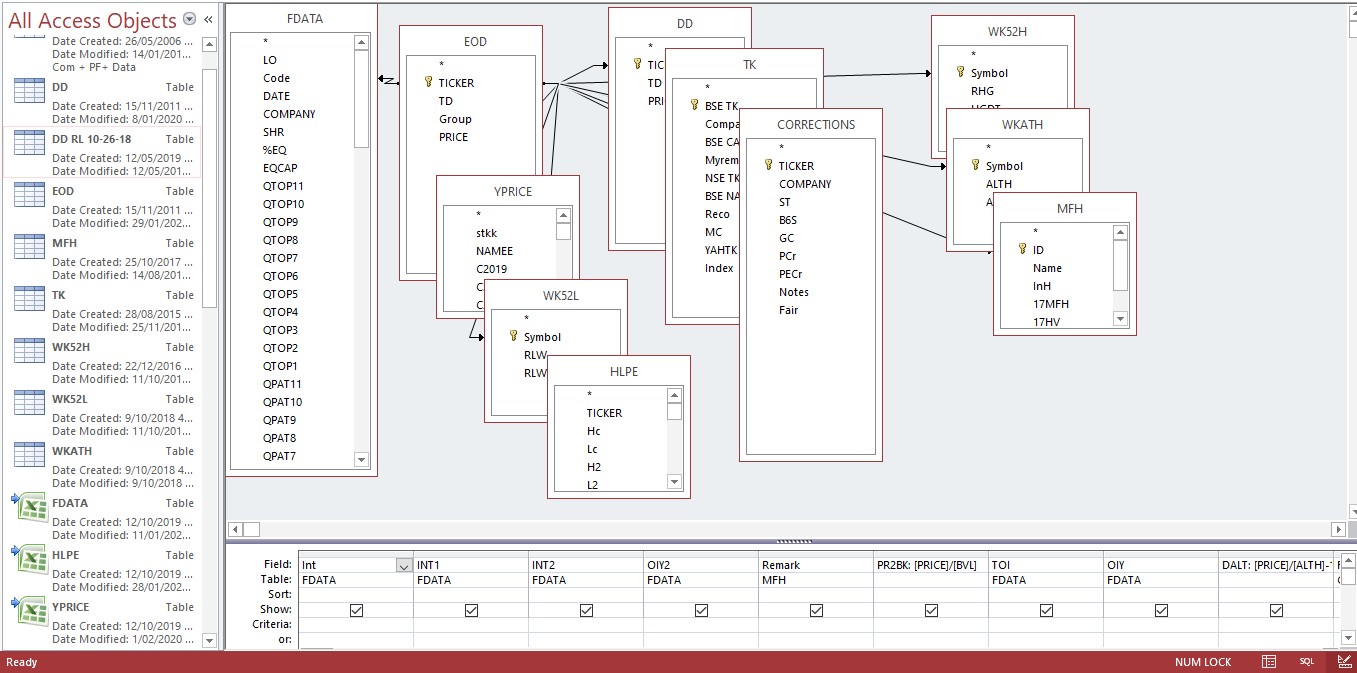
Data Inputs
Excel File containing Quarterly / Annual Results ( Sources: Screener.in , Ratestar .in )
EOD files from BSE Site
All are linked via Access Query and the result is expressed in an Access Form
https://drive.google.com/file/d/1vIoUsVRN4RGOtY2cISATGECUeov_p3Ij/view?usp=sharing DOWNLOAD LINK